Презентація на тему:
"Simple Linear Regression as an example of the actual processes description"
Завантажити презентацію


: Third (satisfactory): Fourth (unsatisfactory...")


) Regression Equation — Determinati...")

"Simple Linear Regression as an example of the actual processes description"
Завантажити презентаціюПрезентація по слайдам:

Simple Linear Regression as an example of the actual processes description Research work Pavel Shevchenko

Goals To confirm hypothesis: the anxiety level of computer addict is in direct proportion to the amount of time he spent on computer games; To predict the dependency between the average score of for assessment and evaluation of of the selected object; Find a major factor getting a high average score on the example of students from 9-A grade in public institution Dneprorudnenskaya High School "Sofia" in the 2011-2012 school year.

Preamble The Method of Regression analysis has a big popularity nowadays. It has been successfully applied in the analysis of experimental data in the various fields of science: psychology, economics, sociology, physics, chemistry, geology, automation and others. For example, in the economy of these methods can be used to find the relationship between the cost of advertising a product and generate revenue from sales. This example will start a conversation about Simple Linear Regression, which can be used to describe the actual processes.

General Ideas and Conceptions Regression - functional relationship between independent variables and conditional mathematical expectation (average mean) response variable (regressand) . Simple Linear Regression expressed by a linear function: у=bx+a+e. реклама продажа Example of a graph of the linear regression Formulas for finding the coefficients regression equation:

Relationship of Human’s Anxiety Level and Amount of Time, Spending in Computer Games

Summary table of data The auxiliary table for calculation of coefficients of regression № Surname, name, class, age Quantity of hours (in a week) Anxietylaevel 1 АнпиловАлександр,10-А, 15лет 25,53 2,275 2 ГайдашЕкатерина, 10-А, 15лет 16,3 1,525 3 ИванниковВиталий,10-А, 16лет 32,3 3,125 4 КлименкоДмитрий,10-А, 14лет 22,32 2,075 5 КоманчиДмитрий,10-А, 15лет 29,87 2,75 6 КоротковаЛилия,10-А, 15лет 21,78 1,675 7 КупринКирилл,10-А, 15лет 33,7 3,025 8 МартиросянАрам, 10-А, 15лет 21,62 1,875 9 ХлоповАртём, 10-А, 14лет 26,85 2,25 10 ЯкубаАлександр, 10-А, 15 років 37,43 3,05 № хі уі хі2 хіуі уір (уір– у)2 (уі– у)2 1 25,53 2,275 651,78 58,08 2,255 0,0111 0,01 2 29,87 2,75 892,22 82,14 2,632 0,0741 0,15 3 32,3 3,125 1043,29 100,94 2,844 0,2338 0,59 4 22,32 2,075 498,18 46,31 1,975 0,1479 0,08 5 21,78 1,675 474,37 36,48 1,928 0,1863 0,47 6 16,3 1,525 265,69 24,86 1,452 0,8251 0,70 7 21,62 1,875 467,42 40,54 1,914 0,1985 0,24 8 33,7 3,025 1135,69 101,94 2,965 0,3664 0,44 9 26,85 2,25 720,92 60,41 2,369 0,0001 0,01 10 37,43 3,05 1401,00 114,16 3,290 0,8646 0,48 267,7 23,625 7550,57 665,87 2,91 3,16

Let's calculate coefficients of linear regression on the given formulas: Thus, required regression dependence looks like: Let's find determination coefficient on a formula: i i n n ; RegressionStatistics R-square 0,920855 Observation 10 Coefficients Y-interacting 0,033684 independentX 0,086993
: Third (satisfactory): Fourth (unsatisfactory...")
Anxiety Levels The second (low): Third (satisfactory): Fourth (unsatisfactory): The Fifth(High): The First (minimum): The Sixth(extreme): More than 40 hours

Dependence of a GPA of progress and estimates in the chosen subject

Укр. язык Укр. Лит Англ. Яз. Франц/ Немец Рус. Яз. Литер. Истор.Укр. Всем. Истор. Право Алгебр Геометр. Биолог географ. физика химия худ. Культ. труды информ. черчен. О.Б.Ж. Анпилов 9 10 9 9 10 11 10 10 10 8 8 12 8 8 8 8 9 9 8 9 Бабич 5 4 4 4 5 5 6 5 8 4 4 4 5 6 5 5 8 7 4 6 Бирюкова 8 5 5 10 8 8 8 8 8 4 4 5 6 5 4 8 10 9 8 10 Бородина 9 9 8 10 10 11 10 10 10 10 10 9 9 8 9 12 11 8 12 10 Воропай 5 6 4 7 6 7 7 8 6 4 4 6 6 6 3 7 10 7 5 10 Гаврилов 7 8 4 8 7 8 8 8 6 7 6 6 7 6 5 7 7 9 6 10 Герда 4 3 5 5 6 4 4 4 5 4 3 4 4 3 3 5 8 9 4 8 Иваников 7 8 7 6 9 7 9 8 7 8 7 8 9 8 7 8 9 10 7 9 Клименко 5 3 4 5 5 6 5 4 3 4 4 4 4 3 2 5 8 6 4 5 Команчи 4 3 4 3 5 4 5 6 3 3 3 4 3 3 2 3 8 8 1 3 Кононенко 7 4 5 6 7 8 7 7 7 4 4 5 6 5 4 6 10 9 4 7 Коржова 7 7 8 7 8 9 9 9 8 9 8 7 10 7 8 9 11 10 7 10 Короткова 9 9 8 8 10 9 9 10 8 8 8 8 8 7 9 8 9 11 8 9 Кретинин 5 2 3 4 4 4 5 5 5 3 3 4 4 3 2 4 7 5 5 9 Кулиш 6 4 4 4 6 5 6 7 6 4 5 5 5 4 4 5 9 8 5 6 Куприн 7 9 7 8 8 9 8 8 7 10 10 8 7 10 8 7 8 10 8 10 Лашина 8 6 6 7 8 8 8 8 7 4 4 6 6 6 6 7 9 7 6 9 Мартиросян 9 9 9 7 10 10 8 9 7 10 10 9 7 9 10 9 9 10 7 9 Мишин 9 7 8 8 9 9 9 9 9 9 8 7 8 7 6 8 9 9 4 10 Овчаренко 7 6 8 6 7 6 8 8 7 8 9 7 7 9 8 7 9 10 7 9 Приймак 7 7 9 7 8 8 8 9 10 7 6 6 8 6 5 8 9 10 6 9 Ревуцкий 8 7 5 7 9 8 7 7 7 4 4 6 8 5 4 7 9 9 5 9 Савина 6 3 3 5 7 6 7 9 5 5 4 4 4 5 6 6 10 8 5 9 Семенько 11 11 10 10 11 11 10 10 10 10 10 10 10 9 10 10 10 11 10 11 Сенюк 8 8 6 6 7 9 8 8 9 6 4 6 7 5 6 9 10 8 7 9 Тарасенко 5 3 4 5 6 4 6 6 3 4 4 4 3 4 3 4 8 8 4 4 Хлопов 4 4 5 4 6 4 5 4 4 3 3 4 4 3 2 4 8 7 6 4 Шевченко А. 7 3 3 8 7 8 7 6 5 4 4 5 6 5 4 7 9 9 3 8 Шевченко П. 11 12 10 12 10 11 10 10 10 12 12 10 10 10 11 10 11 11 10 11 Якуба 4 2 4 3 6 4 5 6 5 4 4 6 4 2 3 3 8 8 5 5

№ Subject Regressionequation R2 1. Ukrainian -0,056427Х+0,460754 0,017192 2. UkrainianLiterature 0,410689Х-3,674509 0,361694 3. English 0,018284Х-1,070215 0,000985 4. French/German -0,011133Х-0,165561 0,000314 5. Russian -0,131005Х+1,564919 0,099026 6. Russian Literature 0,138371Х-0,416191 0,071131 7. Ukrainian History 0,132193Х-0,371958 0,073561 8. WorldHistory -0,137436Х+1,643689 0,078221 9. Government -0,049057Х+0,305199 0,006299 10. Algebra 0,301833Х-2,851595 0,197649 11. Geometry 0,265489Х-2,849642 0,135763 12. Biology 0,003642Х-0,618085 0,000049 13. Geography 0,015582Х-0,55993 0,001238 14. Physical Science 0,061598Х-1,43993 0,012897 15. Chemistry 0,3185131Х-3,572711 0,247366 16. Esthetical Science 0,0470855Х-0,3196468 0,010362 17. Трудовое обучение -0,665022Х+6,738602 0,700871 18. Computers -0,463331Х+5,034262 0,435323 19. Technical Drawing -0,028611Х-0,676069 0,001623 20. LifeScience -0,12703Х+2,306156 0,028974

i i n n The regression equation for algebra Let's calculate coefficients of linear regression on the given formulas: Thus, required regression dependence looks like: Let's find determination coefficient on a formula:

Let's carry out the regression analysis in the MS Excel Regression mode. Work with the program is presented in the following drawings:

Let's generate results on regression statistics are necessary and we will present them in the table: Proceeding from calculations, we can write down the regression equation as follows: ; . Регресійна статистика R-квадрат 0,1976 Спостереження 30 Коэффициенты Y-пересечение -2,851595 Переменная X 0,301833

i i n n The regression equation for labor Science Let's calculate coefficients of linear regression on the given formulas: Thus, required regression dependence looks like: Let's find determination coefficient on a formula:

Let's carry out the regression analysis in the MS Excel Regression mode for confirmation of settlement data. Proceeding from calculations, we can write down the regression equation as follows: ; . Регрессионнаястатистика R-квадрат 0,700865 Наблюдения 30 Коэффициенты Y-пересечение 6,738609 Переменная X -0,665023

Finding of the main factor of receiving by the pupil of a high GPA of estimation № Familyname GPA Number of Absences Time for hw (IQ) 1 Анпилов 9,2 184 15,5 126 2 Бабич 5,2 239 7 86 3 Бирюкова 7,1 145 9,52 101 4 Бородина 9,8 161 8,48 129 5 Воропай 6,2 203 7,44 89 6 Гаврилов 7,0 74 8,97 107 7 Герда 4,8 111 4,65 83 8 Иваников 7,9 168 16,36 111 9 Клименко 4,5 58 5,63 84 10 Команчи 3,9 198 4 83 11 Кононенко 6,1 67 17,69 90 12 Коржова 8,4 280 23,54 115 13 Короткова 8,7 148 16,52 122 14 Критинин 4,3 137 3,85 78 15 Кулиш 5,4 50 6,48 92 № Family name GPA Absences Time for hw (IQ) 16 Куприн 8,4 30 21,46 117 17 Лашина 6,8 47 13,28 100 18 Мартиросян 8,9 181 17,87 128 19 Мишин 8,1 108 16,01 114 20 Овчаренко 7,7 124 19,32 113 21 Приймак 7,7 298 18,63 110 22 Ревуцкий 6,8 84 17,5 101 23 Савина 5,9 127 15,2 98 24 Семенько 10,3 202 14,42 131 25 Сенюк 7,3 65 18,51 107 26 Тарасенко 4,6 287 8,3 84 27 Хлопов 4,4 169 4,98 88 28 Шевченко А. 5,9 57 11,37 95 29 Шевченко П. 10,7 116 12,87 136 30 Якуба 4,6 283 5,63 89

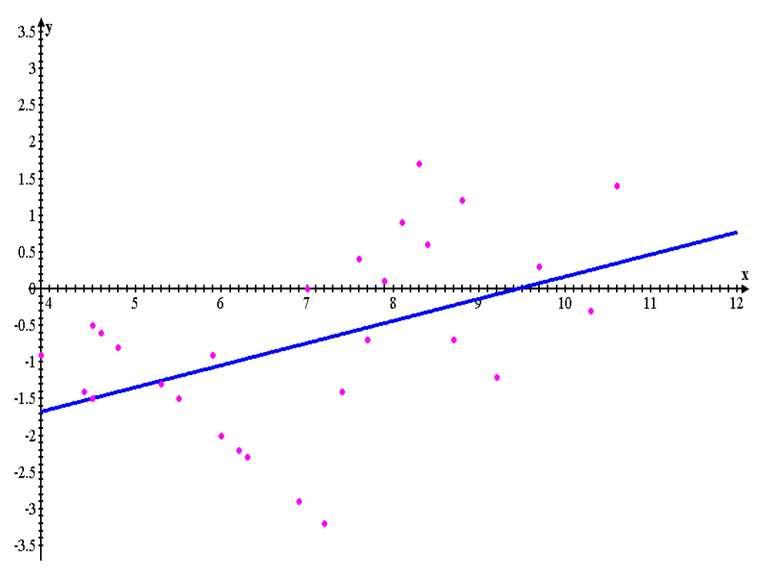
Factor No. 1: Visit of lessons Regression Equation — Determination Coefficient — The schedule and the chart of dispersion visually prove lack of linear dependence. The theoretical line of regression passes almost parallel to abscissa axis, and it states lack of linear dependence between variables x and at. That is it is possible to interpret that attendance of lessons isn't the main factor of receiving a GPA of training. Then we will review the following examples.

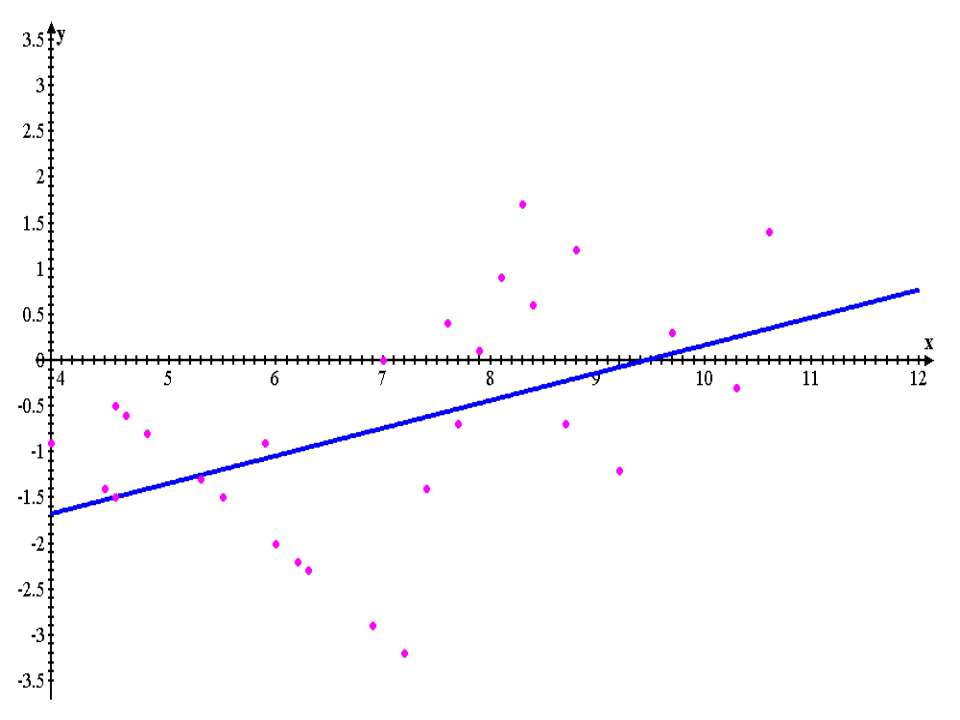
Factor No. 2: Time of homework Regression Equation — Determination Coefficient — About a half of points are at a straight line, as confirms determination coefficient. That is if diligence, persistence and definiteness in achievement of the purpose also isn't the main factor for receiving an appreciation, precisely is a component of this process.
) Regression Equation — Determinati...")
Factor No. 3: Level of intelligence (IQ)) Regression Equation — Determination coefficient — Summing up this section it is necessary to tell the following: from the mathematical point of view it is proved that the main factor in training is erudition and intelligence, but also it is necessary to consider that all the same study - compound process it is possible to achieve which highest success only in that case when all considered factors are considered.

Conclusion Research objective of real processes are attempts to give the idea of possible ways of further succession of events, to predict this or that situation, to expect the future of values of influencing factors, to specify instruments of studying of a situation in the desirable direction. So, for example, in this work use of pair linear regression for forecasting of various examples of the description of a picture of training of pupils of one (local) class was considered. Are also found negatively and positively influencing factors on further process. Practical value of this work also consists in it.
Схожі презентації


Категорії