Презентація на тему:
"Population of Wellington"
Завантажити презентацію


"Population of Wellington"
Завантажити презентаціюПрезентація по слайдам:

Population of Wellington 2014

Facts & figures Wellington is New Zealand's centre of government and the world's southernmost capital city. It is also the country's cultural and the third most populous urban area in New Zealand.

The people About 449,000 people live in the Wellington region. This is 11.1% of New Zealand’s population. The population mix consists of: 70% European 12.8% Maori 8.1% Pacific Island 8.1% Asian 1.3% Middle Eastern/Latin American/African 11.7 % other (New Zealander) * Note: Total of more than 100% due to people being able to associate with more than one ethnic group.

Quality of living In the Mercer 2014 International Quality of Living Survey, Wellington ranked the 12th out of 221 world cities for quality of living. Workforce and wealth The most common occupational group in Wellington is 'Professionals'. Wellington region has the highest proportion of working age population and the highest median income in the country. For people aged 15 years and over, the median income in Wellington Region is $28,000. This is higher than the median of $24,400 for all of New Zealand. 23.6 percent of people aged 15 years and over have an annual income of more than $50,000, compared with 18.0 percent of people throughout New Zealand. (30.2% in Wellington city).

Education Wellington’s talent pool of well educated, worldly and skilled people is its greatest asset. Wellington people are better educated than the average New Zealander. 46.3% of people aged 15 years and over in the Wellington Region have a post-school qualification, compared with 39.9% of people throughout New Zealand. In 2008, 33 % of Wellingtonians worked in ICT, Architecture, Engineering, Science, Education, Arts Design, Media and Sports occupations.

Environment friendly transport More people use public transport in Wellington than anywhere else in New Zealand. 30% use public transport compared with: 18% in Auckland 9% in Christchurch 10% in Australian and North American cities on average About 23,000 people commute into Wellington City every working day. Source : WCC 11% of Wellingtonians walk to work. More people in Wellington walk or bike to work than the average New Zealander. There are regional initiatives to car pool and encourage cycling and walking to work.

Weather and seasons Wellington has more sunshine hours than London and less rainfall than Auckland. Wellington enjoys around 2,000 sunshine hours a year. By comparison London averages 1,500, Edinburgh 1,350 and Vancouver 1,850. Warmest month: February (17°C average) Coldest month: July (8.7°C average) Average daily maximum for mid-summer: 20.3°C Average daily minimum for mid-winter: 5.9°C Average annual sunshine: 2025 hours Average annual rainfall: 1270mm

Thank you for your attention. By M.Potapenko

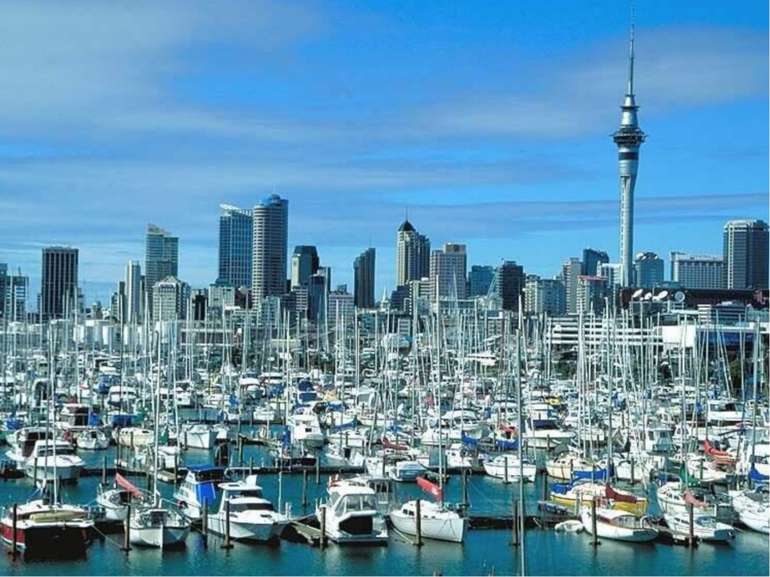
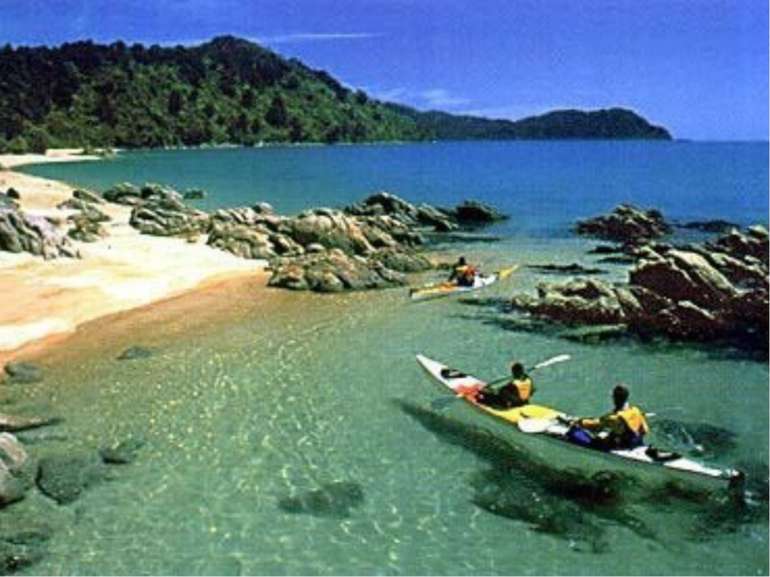
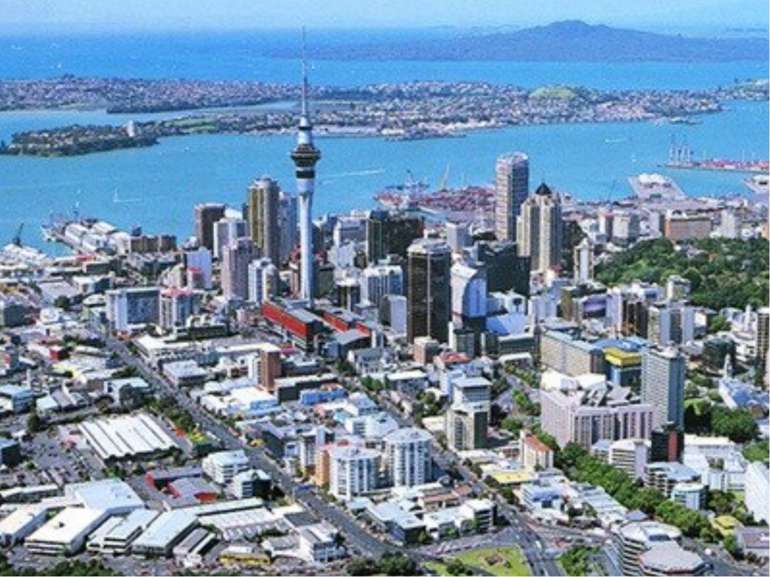
Photos
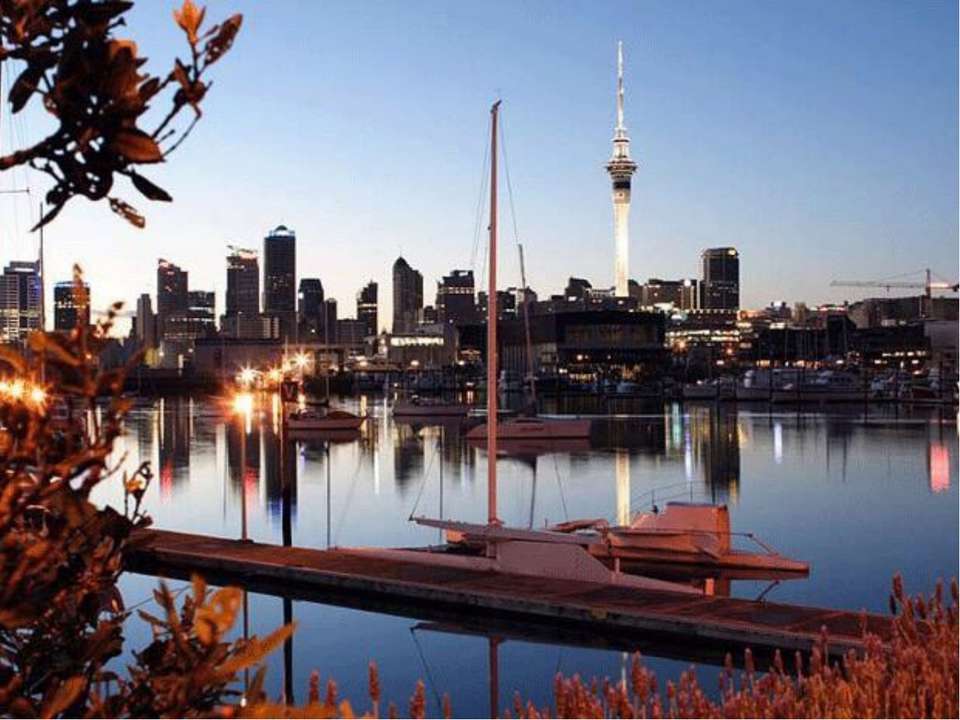


The end
Схожі презентації


Категорії